Back Propagation

Back Propagation

如果遇到非常复杂的网络,是无法通过直接计算。但是如果把网络看作图,通过图传播梯度,就能把梯度计算出来,即反向传播。

$\widehat{y} = w_2(w_1 \cdot x + b_1) + b_2$

$\widehat{y} = w_2\cdot w_1 \cdot x + (w_2 \cdot b_1 + b_2)$

$\widehat{y} = w\cdot x + b$

可以发现,若直接在线形层上增加模型的,其网络的复杂程度依然没有改变。为此我们需要在每一个线性层之后添加一个非线性层(激活函数)。

Chain Rule

$\frac{\text{d}z}{\text{d}t} = \frac{\partial z}{\partial x} \frac{\text{d}x}{\text{d}t} + \frac{\partial z}{\partial y} \frac{\text{d}y}{\text{d}t}$
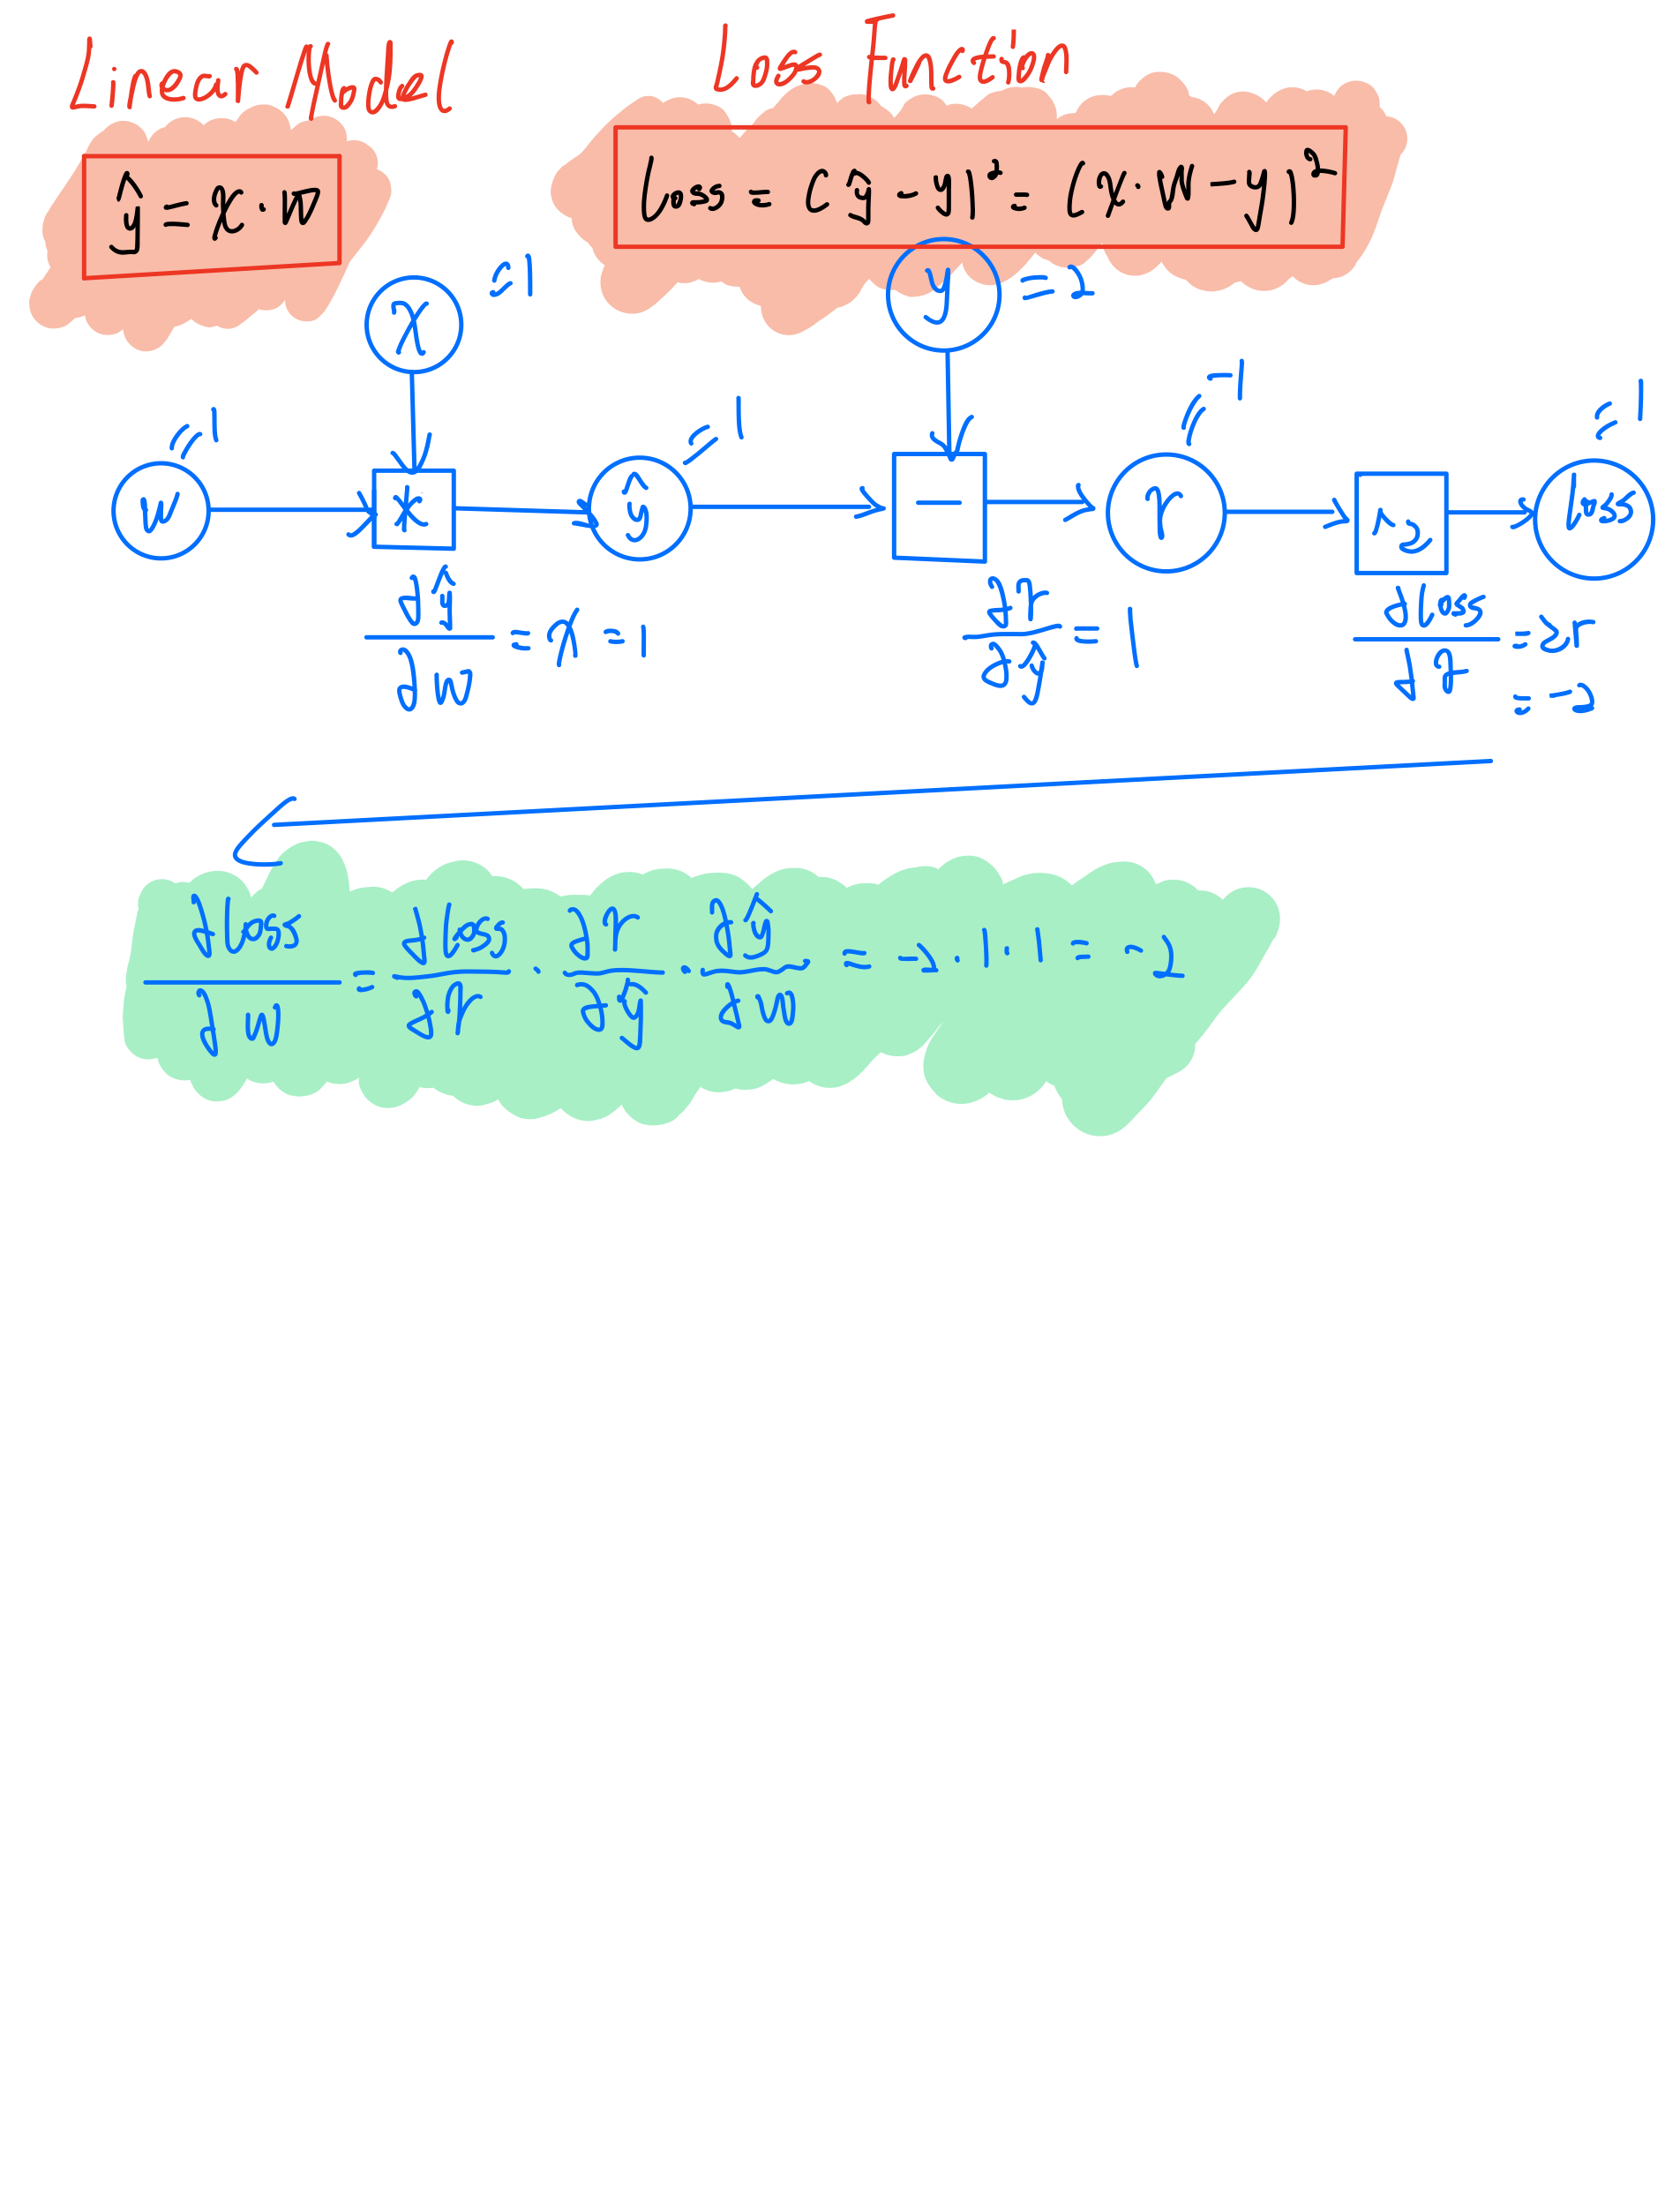
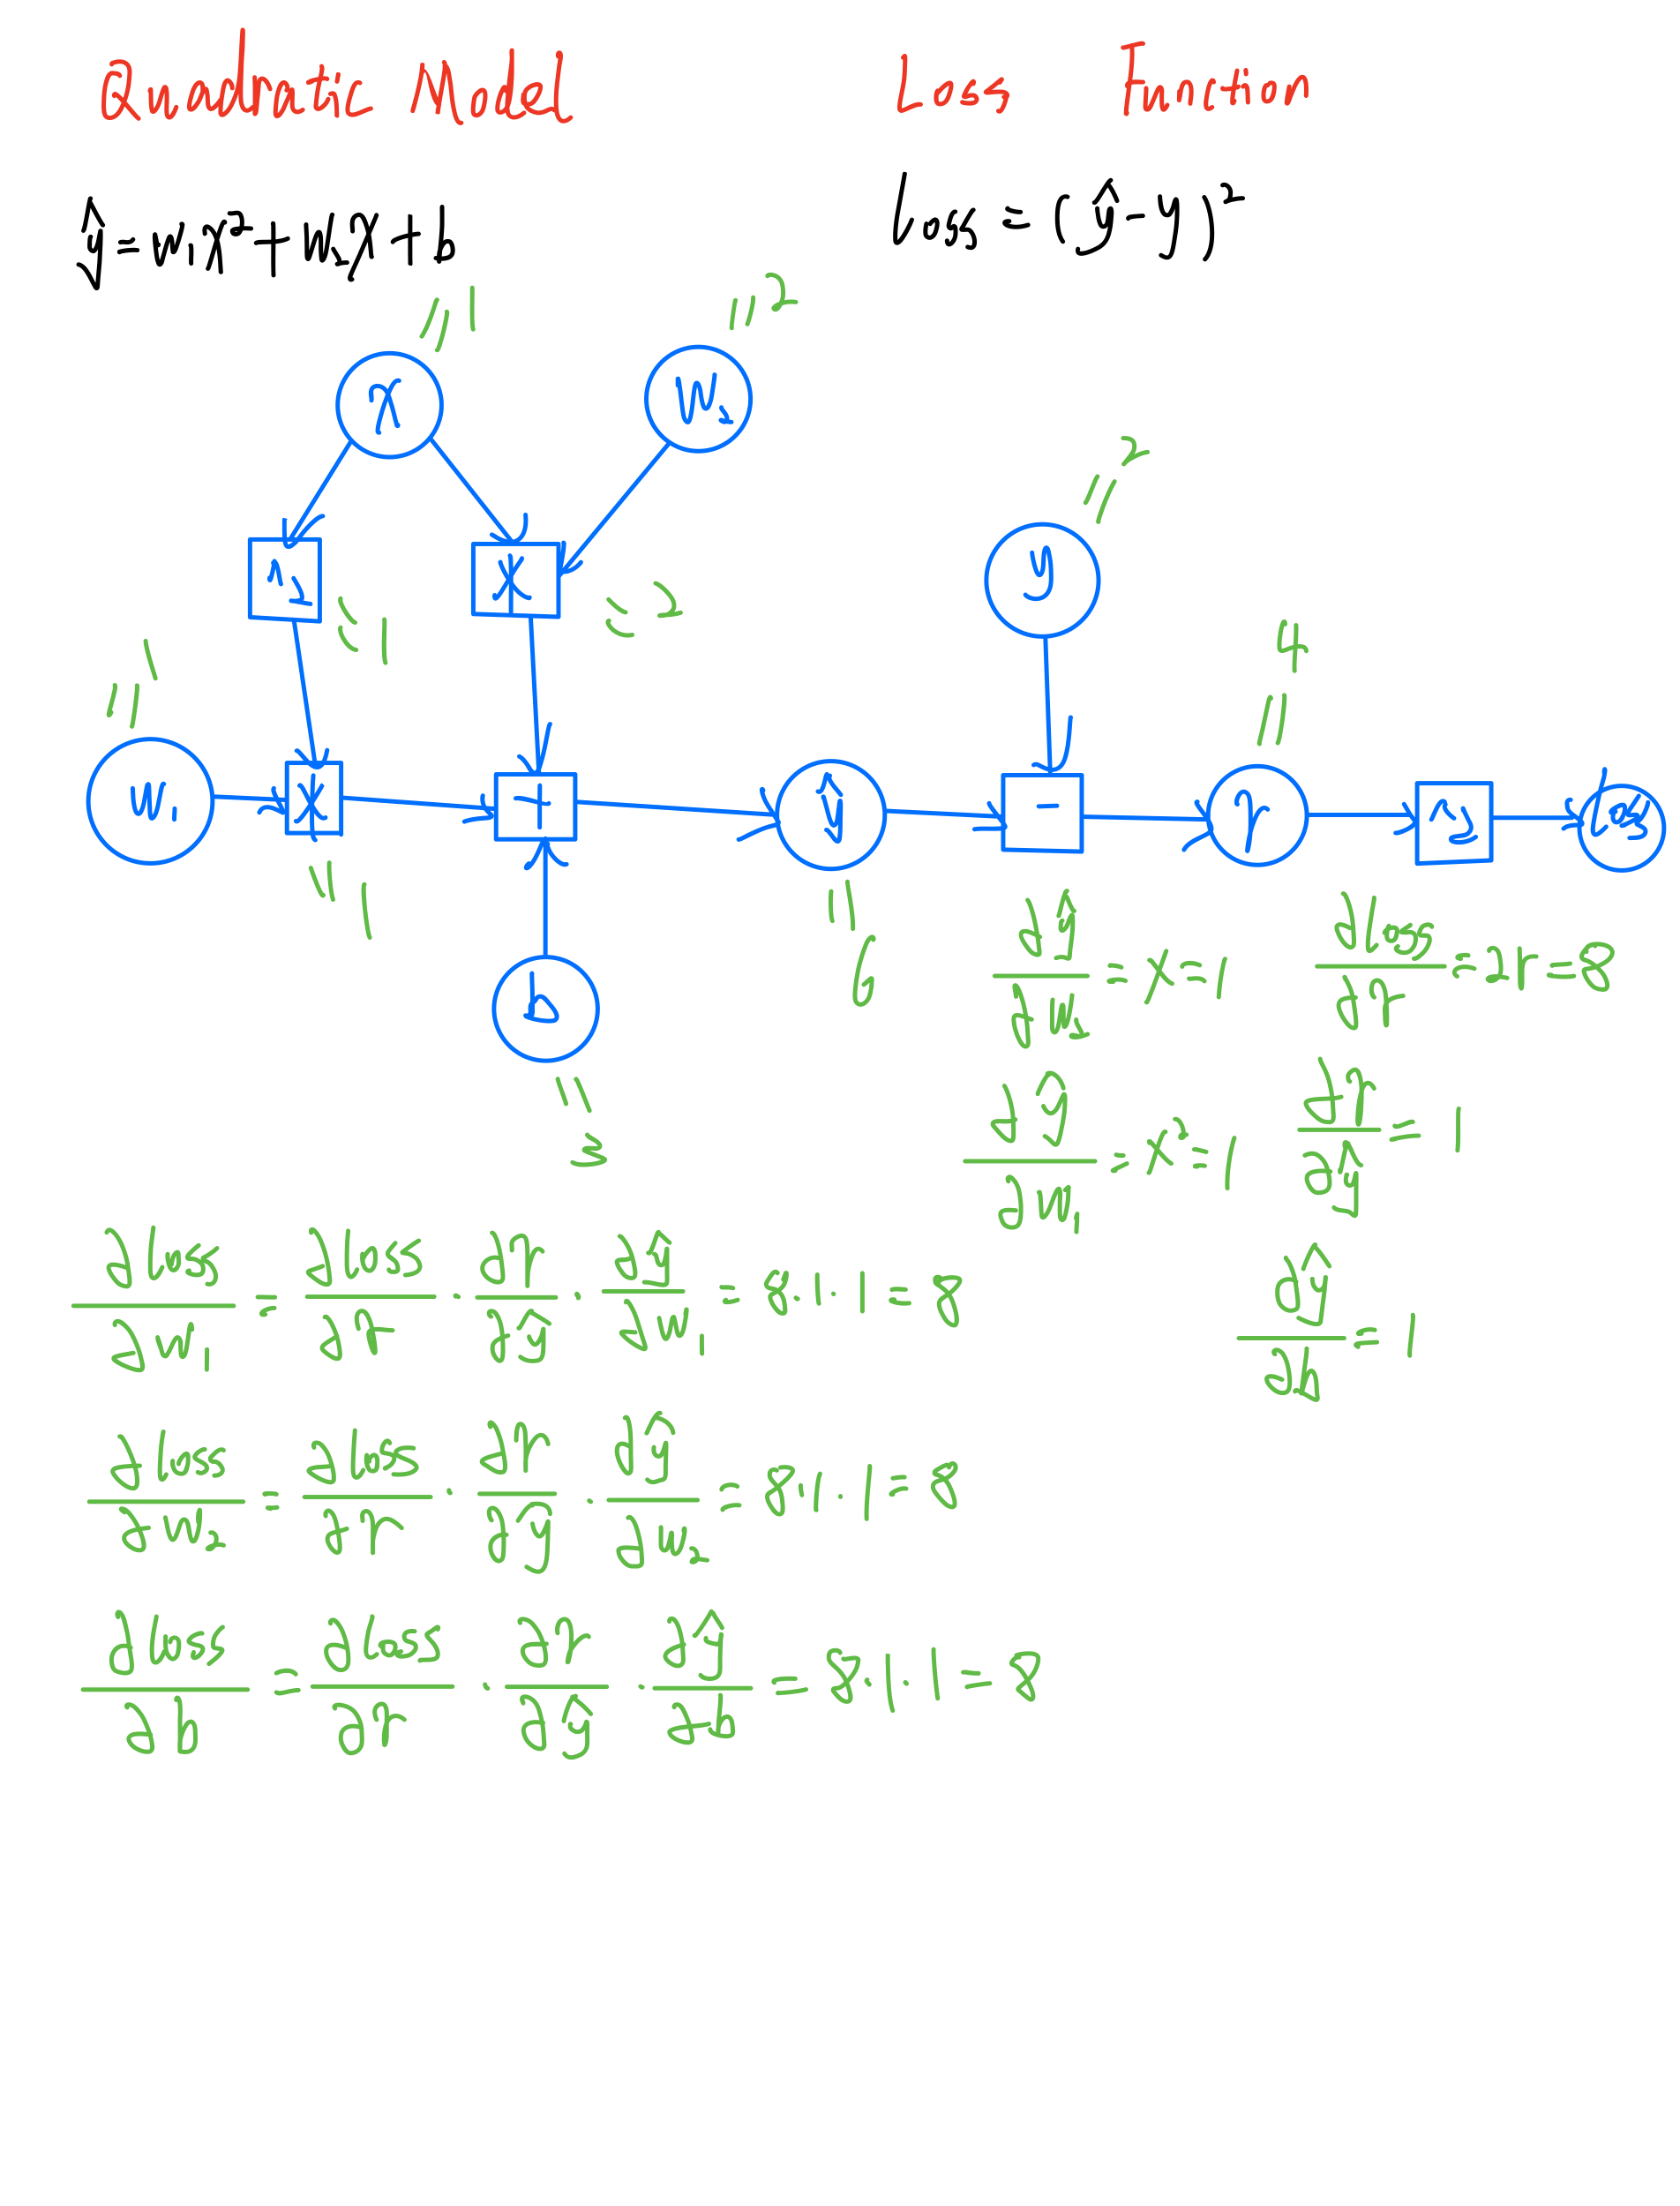
backpropagation
backpropagation

Tensor in Pytorch

Pytorch最基本的数据类型就是Tensor,Tensor可以存标量,向量,矩阵,三维矩阵,高维矩阵等;还可以保存梯度。

1
2
3
4
5
6
7
8
9
10
11
12
13
14
15
16
17
18
19
20
21
22
23
24
# -*- coding: UTF-8 -*-
import torch

x_data = [1.0,2.0,3.0]
y_data = [2.0,4.0,6.0]

w = torch.Tensor([1.0])
w.requires_grad = True # 计算梯度

def forward(x):
return x * w

def loss(x,y):
return (forward(x) - y) ** 2

for epoch in range(100):
for x,y in zip(x_data,y_data):
l = loss(x,y)
l.backward()
print('\t grad:',x,y,w.grad.item())
w.data = w.data - 0.01 * w.grad.data
w.grad.data.zero_()
print('progress:',epoch,l.item())
print('after training:',4,forward(4).item())
1
2
3
4
5
6
7
8
9
10
11
12
13
14
15
16
17
18
19
20
21
22
23
24
25
26
27
28
29
30
31
32
33
34
35
36
37
38
39
40
41
42
43
44
45
46
# -*- coding: UTF-8 -*-
import torch
import matplotlib.pyplot as plt

x_data = [1.0,2.0,3.0]
y_data = [2.0,4.0,6.0]

w1 = torch.Tensor([1.0])
w2 = torch.Tensor([2.0])
b = torch.Tensor([3.0])
w1.requires_grad = True
w2.requires_grad = True
b.requires_grad = True
r = 0.01

def forward(x):
return w1 * (x ** 2) + w2 * x + b

def loss(x,y):
return (forward(x) - y) ** 2

l1 = []
ep = []

for epoch in range(100):
for x,y in zip(x_data,y_data):
l = loss(x,y)
l.backward()
print('\t gard:',x,y,w1.grad.item(),w2.grad.item(),b.grad.item())
w1.data -= r * w1.grad.data
w2.data -= r * w2.grad.data
b.data -= r * b.grad.data

w1.grad.data.zero_()
w2.grad.data.zero_()
b.grad.data.zero_()
print('progress:',epoch,l.item())
l1.append(l.item())
ep.append(epoch)
print('after traning:',4,forward(4).data.item())
print('after traning:',4,forward(4).item())

plt.plot(ep,l1)
plt.ylabel('Loss')
plt.xlabel('epoch')
plt.show()
Donate comment here